The challenge
Royal Oak has a strong story to tell, with a well-known downtown, good schools and public spaces that draw people in. The harder question was who a data page is actually for.
Most economic development data sits on investment attraction pages aimed squarely at site selectors and outside investors. That leaves out the audience a city deals with most: the residents who want to understand their own community, and the local business owners trying to work out where their customers are and who they’re competing with.
The approach
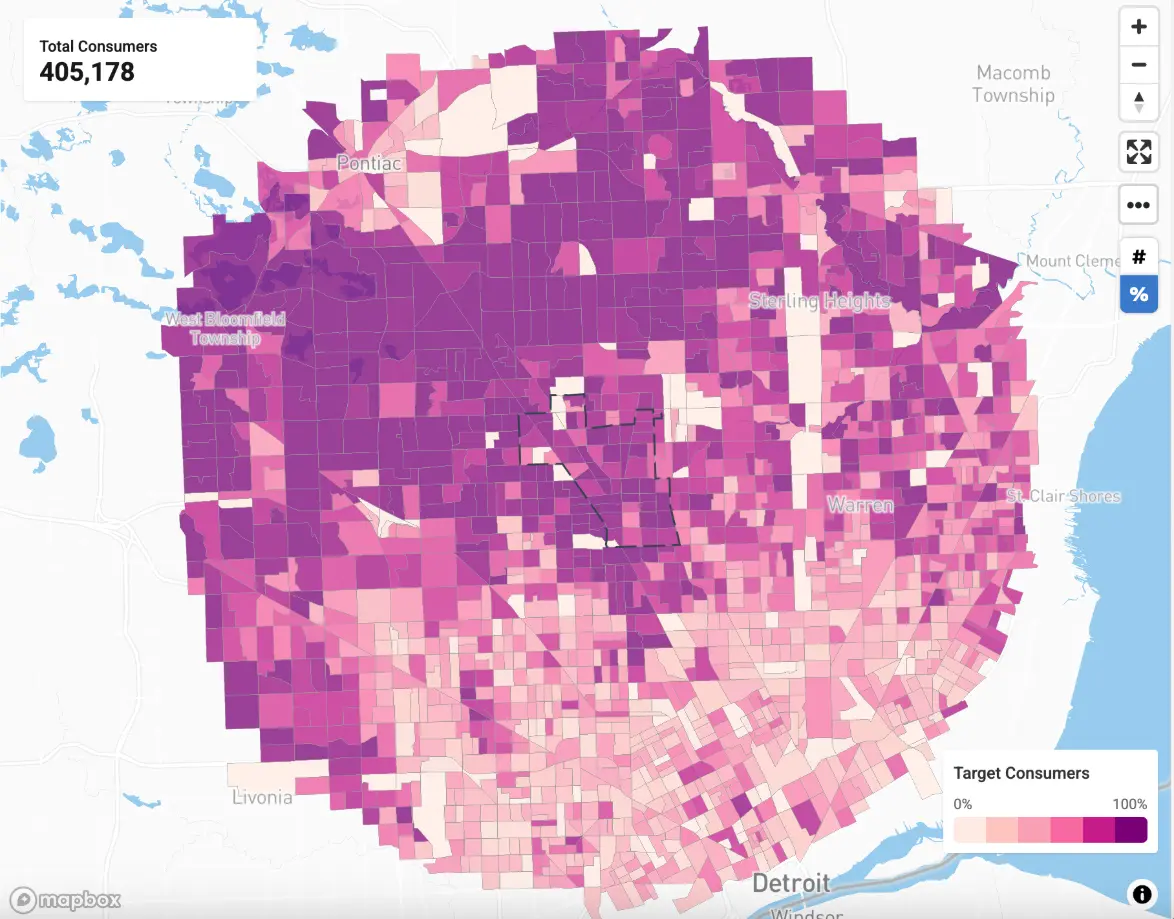
The city’s Interactive Data Research page carries four Localintel Dashboards. Community Profile covers the demographic and economic picture. Market Advantages presents local consumers, dwellings and businesses. Workforce Advantages covers education, employment by industry and occupations. Industry Insights shows which sectors are actually doing well in the city.
What sets the page apart is that Royal Oak didn’t leave the tools to introduce themselves. Each one is framed in the city’s own voice. The Community Profile invites a visitor to “take a stroll down Main Street to learn basic facts about our city and get to know the average Royal Oaker.” Workforce Advantages opens with “finding good help can be challenging but, look no further.” The data underneath is the same data any site selector would get. The framing is written for someone who lives there.
The page is also honest about its limits, pointing visitors to SEMCOG, the regional council of governments, for anything it doesn’t cover.
The result
Royal Oak has one page that answers the questions a resident, a local business owner and an outside prospect each arrive with, without maintaining three separate resources or asking anyone to fill in a form first.
All four dashboards have moved to newer versions since the page launched, picking up better data and presentation without the city rebuilding the page or touching a line of embed code.
The same data a consultant would screen on, written for someone who lives on the street it describes.