The challenge
RMED’s job is to help rural communities of very different sizes be understood on equal terms. That makes consistency a credibility question, not a presentation one. CEO Margot Cathcart put it plainly: the organization cannot appear to be picking winners and losers based on who gets better information.
The old model made that hard. RMED published one static economic profile per region as a downloadable PDF. Research and Data Manager Michael Asante built them in-house in Excel, with manually constructed charts, manual updates and several approval stages before anything went out. The last set, 10 regional profiles produced around 2022, took months. Sourcing the data, cleaning it, rebuilding the charts and managing the spreadsheets left the work slow and fragile, where a single mistake could carry through multiple outputs.
The approach
RMED had already been running Localintel Dashboards across its website. What it wanted next was something more interactive and more automated on top of that foundation.
The division of labor is worth being precise about. RMED built the regional pages on its own website. Studio supplied the content that sits on them.
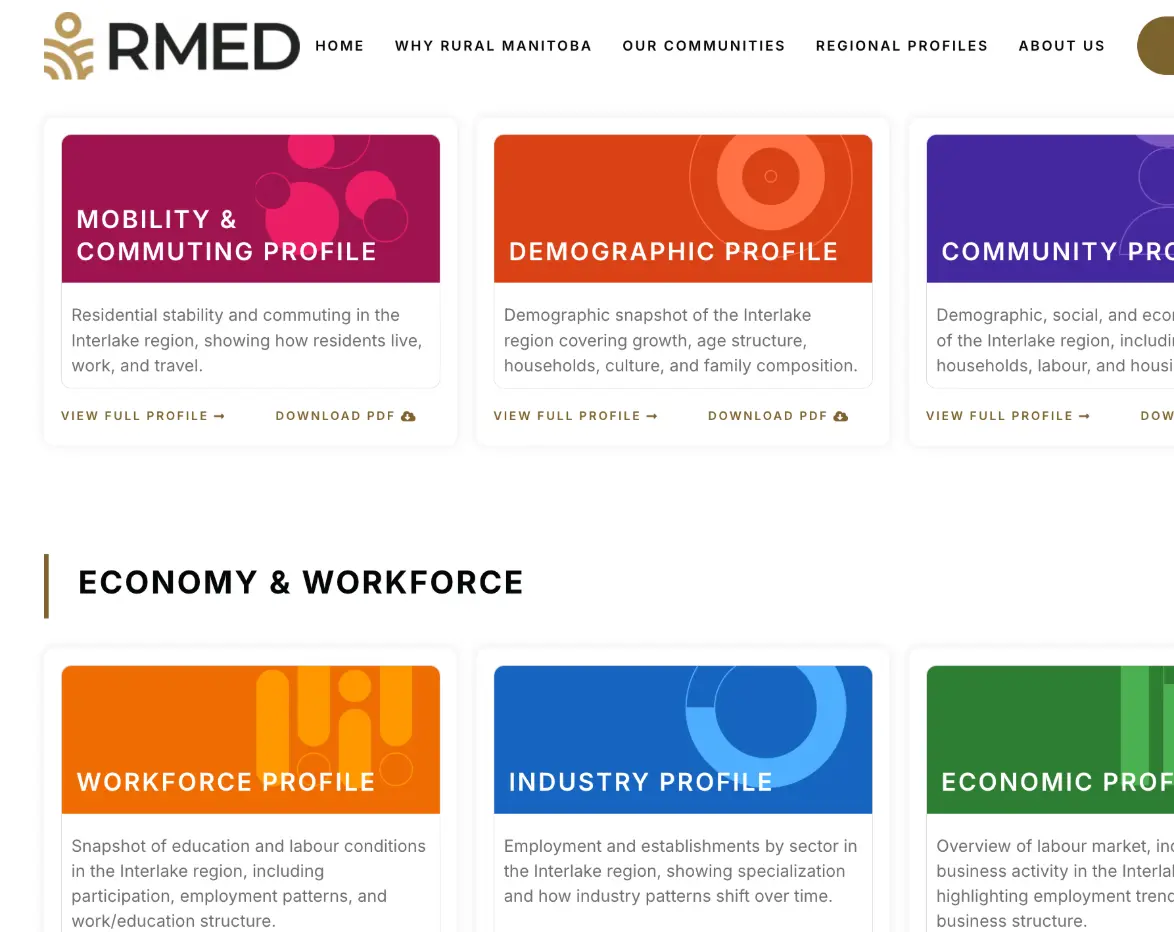
Each region now has its own page covering eight topics: workforce, quality of life, mobility and commuting, housing, economy, demographics and community. For every topic, a visitor can either download a report or open a full interactive profile. That comes to 64 reports and 64 profiles across the eight regions, none of them built by hand.
Once RMED had decided what to feature, designing the pages, adding the content and checking it took roughly a week of full-time work with the web team.
“It’s saving us not just a little bit of time, it’s fundamentally defining the kind of work we can do.”
The result
Every region gets the same treatment across the same eight topics, in the same two formats, to the same standard. Regardless of a community’s size or capacity, the information available to it looks the same as the information available to everyone else.
The profiles update automatically as new data is released, so the maintenance burden that came with the old spreadsheets is gone. Visitors get a choice too, a report to download and circulate, or an interactive profile to explore.
“Previously, because they were static, you can only come in and download the reports and go. But now you are able to play with the data, play with visualization, see trends and understand better how the data is for each of our regions.”
The smallest region on the list now gets the same eight topics, in the same two formats, as the largest. That was the point.