Where the data comes from, and why you can stand behind it.
Localintel brings together public, licensed and your own data, keeps it current, and shows the source behind every figure. Here’s how.
Why outputs hold up
Generic AI draws on the open web, so numbers can be wrong, geography can be off, and sources can’t be cited. Localintel works differently. Every output is generated from the governed data in the platform. The AI draws only on curated, sourced indicators, never the broader internet.
When someone asks where a number came from, there is a named source, a reference period and a geography behind it.
Four sources, one library
Public, licensed, yours and ours, held together with the same sourcing, the same dates and the same tools.
Public
Government statistical agencies and open data in the U.S. and Canada: census, labor, business, housing and more. The foundation of every location we cover.
Including Statistics Canada, the U.S. Census Bureau, the U.S. Bureau of Labor Statistics and the Bureau of Economic Analysis, plus open data such as OpenStreetMap and OurAirports.
Licensed
Commercial data from established providers, included in your subscription. Data your team would otherwise have to find, negotiate and pay for separately.
Yours
Permits, programs, facilities, surveys, anything your organization collects about your community. We integrate it so it sits alongside everything else, with the same sourcing and the same tools.
Localintel
For selected indicators where a source stops short, we provide estimates for small geographies, projections forward from the latest release and imputed values where a figure is suppressed or missing. Each is labeled as ours, with the method noted, so it is never mistaken for a published figure.
Indicators
An indicator is a sourced measurement about a community at a point in time. Some are a single figure: a rate, a count, a median, a share. Others are a breakdown or a ranking built from those figures: employment by sector, the fastest-growing industries, the largest employers within a sector. Some are the headline numbers on a dashboard or in a report; most sit behind them as the trend, the comparison or the denominator.
Every indicator travels with its geography, source, reference period, update date and topic, so the answer to “where did this come from?” is already attached.
Topics
Indicators are organized into fourteen topics, each carrying its key figures, trends over time, plain-language context and dated sources.
- Affordability
- Diversity
- Economy
- Education
- Households
- Housing
- Immigration
- Income
- Industry
- Language
- Mobility
- Population
- Workforce
- Location
Places and layers
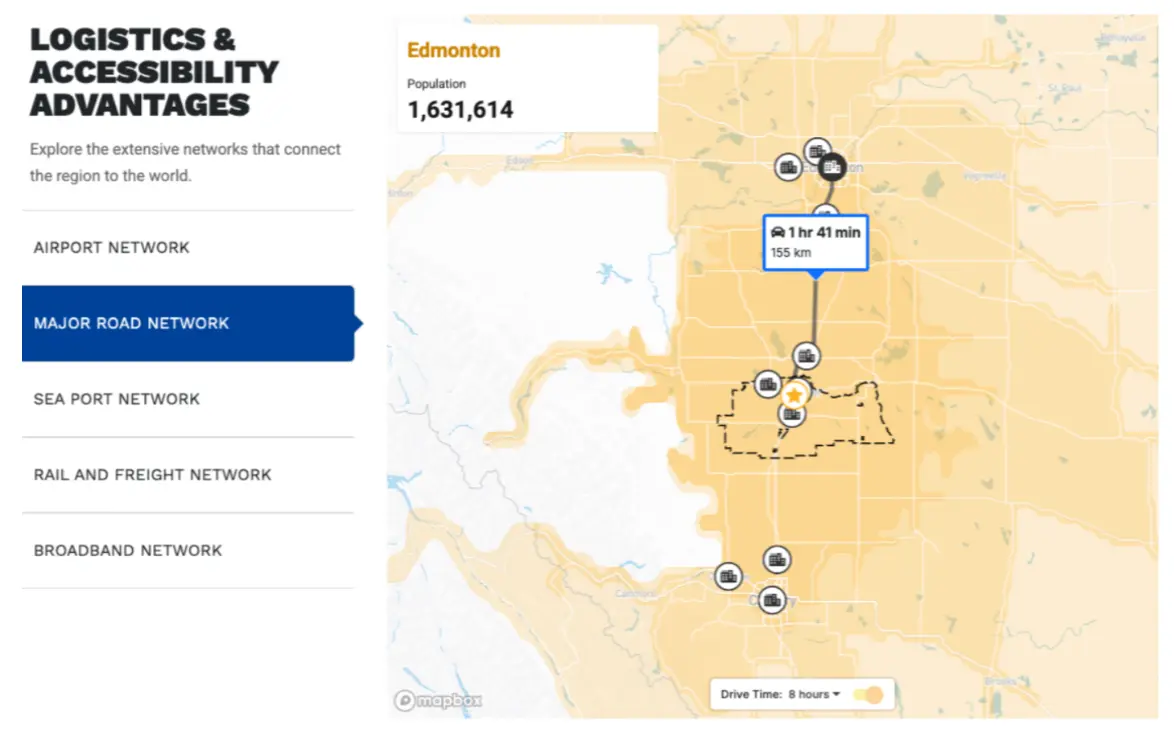
A place is anything you can point to on the map in and around your community: an airport, a port, a hospital, a school, a park, a neighboring town. Alongside places sit layers that cover ground rather than points: roads, rail lines, land use, zoning, environment. Each place and layer carries its own source and date, so “three airports with scheduled service within 60 minutes” is as defensible as an unemployment rate. Maps, dashboards and reports draw on the same library, so they agree.
Data lineage
Open any data point and you can trace it back: which release it came from, what period it covers, when it was last refreshed. The same five fields sit behind every chart, map, report and answer, so a number quoted in a council meeting can be defended a year later.
Coverage
Localintel covers the United States and Canada, at every level from municipality to state and province.
Places
Municipalities, counties, metro areas, economic regions, states and provinces across the United States and Canada, plus comparison geographies where relevant.
- Municipality
- County
- Metro area (MSA)
- State
- Municipality
- Census division
- Metro area (CMA)
- Economic region
- Province
Availability varies by place and indicator. Tell us your location and we’ll confirm what’s available the same day.
Custom regions
Define your own geography from any set of municipalities, counties or census areas: a trade area, a corridor, a service territory or a partnership of neighboring communities.
Every indicator is aggregated for that region, sourced and dated like any standard geography, and available across every product.
Fits how your organization already works
Localintel doesn’t replace your review process. It gives teams a stronger starting point, so the work that remains is checking, framing and approving, not assembling figures, charts and narrative from scratch.
- Every output includes named sources your team can cite
- Methods and reference periods are shown so teams can explain what they’re using and why
- Outputs are structured for review, not for unedited publishing
- Consistent indicators across departments reduce version drift