Trusted by 250+ government and non-profit organizations across the U.S. and Canada.






The same numbers behind everything you publish.
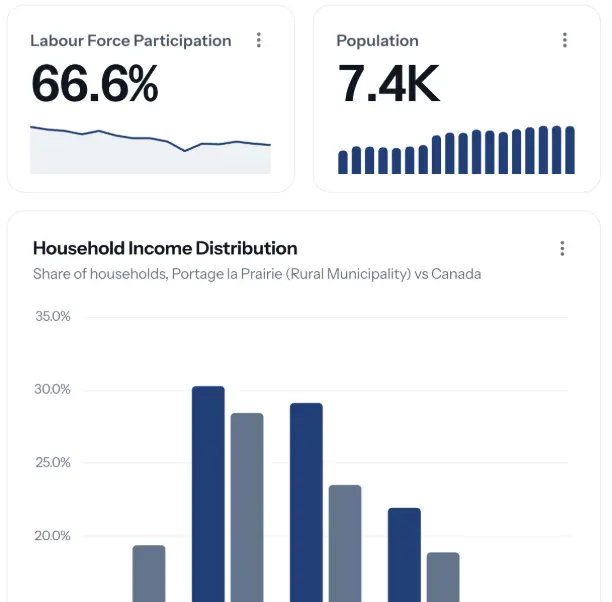
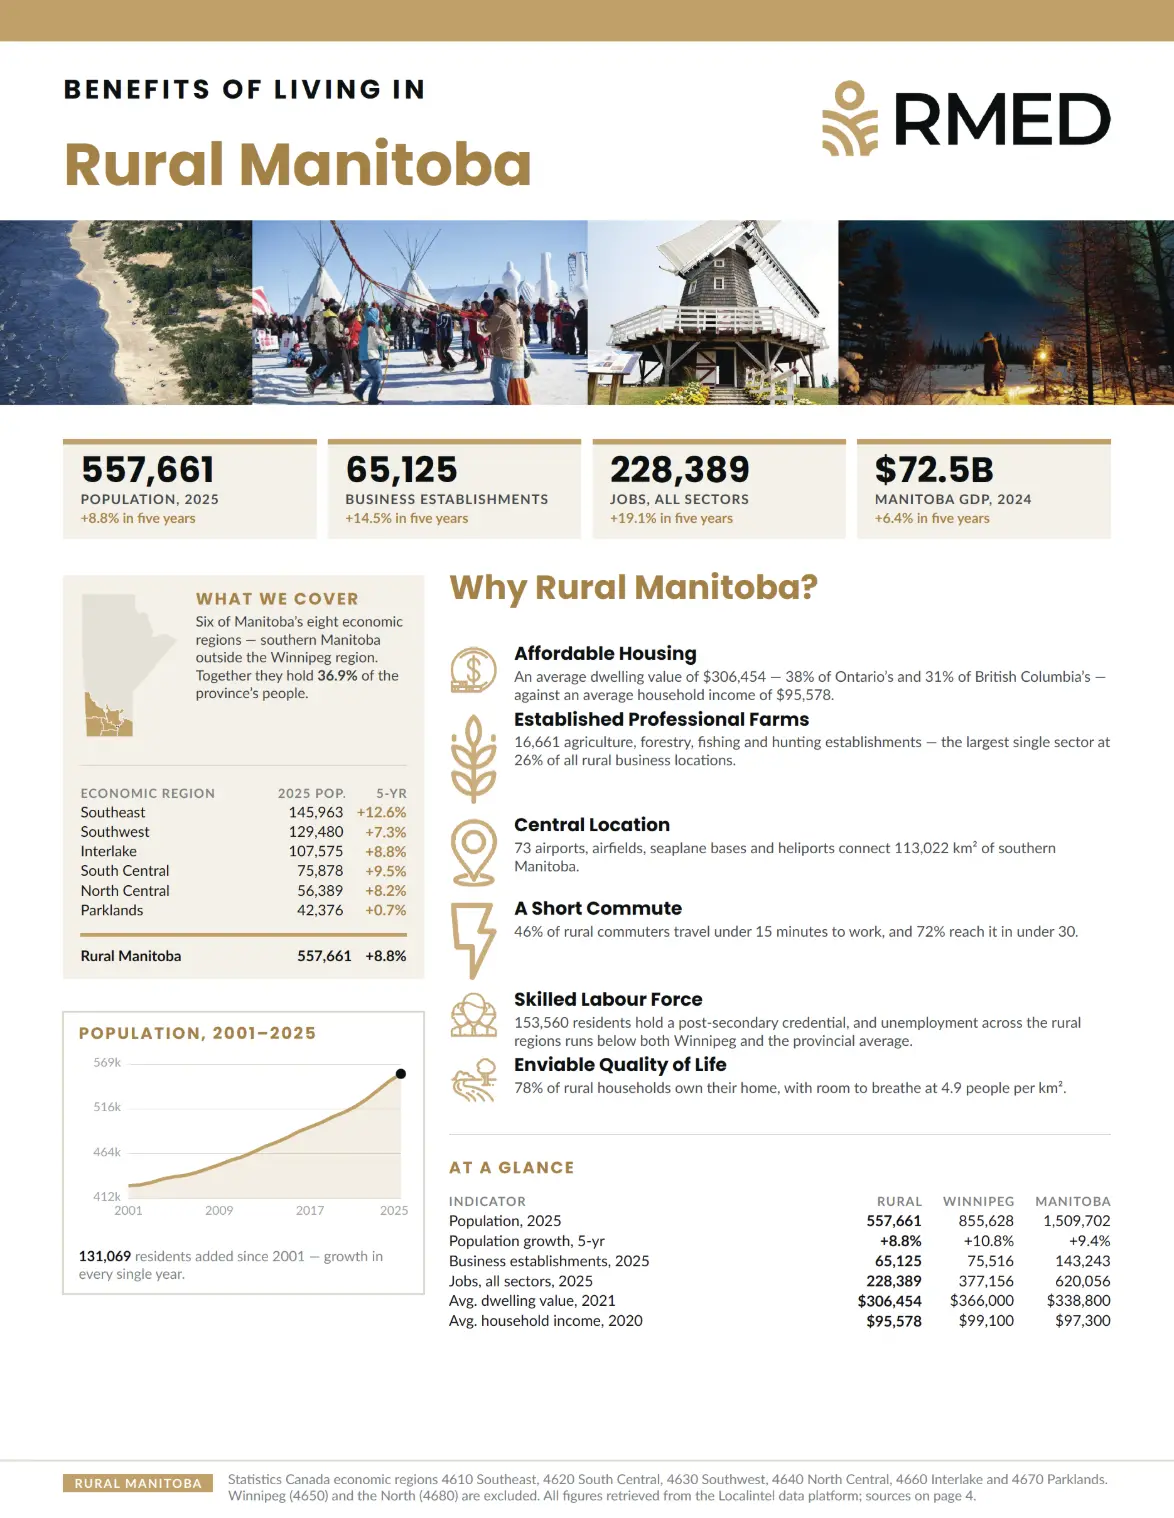
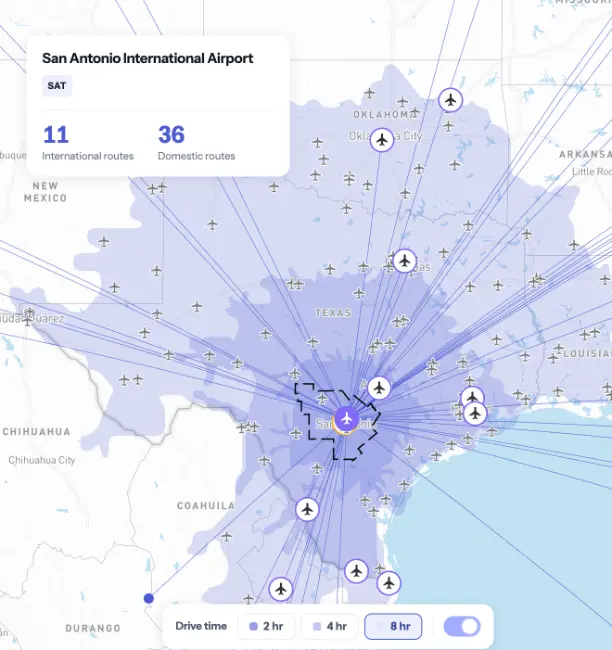
Every product runs on one platform, so your reports, dashboards and charts always agree and carry your branding. Use one for a specific job, or bring them together with Localintel One.
Not sure which is the right fit?Compare the products
Your team is asked to communicate more. With less.
Whether it’s a council request, an investor inquiry, a report deadline or a website update, teams are stuck doing the same work over and over: finding data, building charts, writing explanations, and trying to make it all credible.
Scattered data
The information you need is spread across public, licensed and internal sources, making it hard to find, trust, and turn into something ready to share.
Specialist bottlenecks
Too much depends on analysts, GIS staff, designers or outside consultants. Every new request means another queue, another delay.
Untrusted AI
Generic AI can help draft, but it can’t reliably produce trusted, place-specific figures you can confidently publish or defend.
Connected from the start.
Every product runs on the same foundation, so a report, a dashboard and a chart about your community will always agree with each other.
Trusted data
Public, licensed and your own data, brought together. Every fact carries its source, reference period and geography, and stays current as sources update.
Brand kit
Your colors, logo and typography, applied automatically to every report, dashboard, chart and map you make. White label available.
Publishing & hosting
What you make is hosted and kept running: live on your website, refreshed as data is released or pinned to a dated snapshot, with usage analytics.
Built for your team
One account for the whole organization. Roles, permissions and controlled publishing, so the right people make and approve the right things.
Built for every team that talks about your community
Economic Development
Answer RFIs, support investor conversations, and keep your website and collateral current without starting from scratch.
Planning & Development
Staff reports, public-facing materials and council briefings built on credible maps, charts and plain-language narrative.
Communications & Engagement
Sourced visuals and plain-English stories that explain what’s happening where, across web, social and newsletters.
Parks & Recreation
Show who your facilities serve and why investments matter, for grants, master plans and reporting.
Grants & Funding
Strengthen applications and progress reports with sourced charts, maps and narrative.
Leadership
Align departments around one set of indicators and a defensible narrative for budgets, planning and high-stakes briefings.
What teams are doing with it
All customer storiesWhere the data comes from
Public sources, licensed data included in your subscription, and your own datasets. Every indicator links to its source, its reference period and its geography. Outputs are generated from the governed data in the platform, never from the open web, so when someone asks where a number came from, the answer is attached.
The DataSee how it works.
Book a demo and we’ll walk you through the products and Localintel One, and confirm what’s available for your location.